


The report provides important trends on some of the important labour market indicators. Among the employment indicators, the one that attracted attention even before the report was officially released[1] was the unemployment rate – at 6.1 percent, this rate was at its highest since at least 1972–73 (when the NSS EUS was first conducted). The overall labour force participation rate[2] (LFPR) was just below 50 per cent in 2017-18, declining by about 14 percentage points from 2004-05.
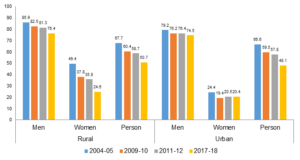
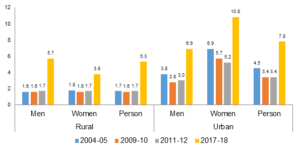
Much has been discussed about the low and declining female labour force participation rate (FLFPR) in India, and multiple explanations advanced towards explaining this trend, such as increased education levels among women, rising household income (income effect), measurement issues (substantially higher proportion of women attending to domestic duties) and a general decline in the employment opportunities for women (Mehrotra and Sinha, 2017; Klasen and Pieters, 2015; Chaudhary and Verick, 2014; Kapsos et al., 2014; Lahoti and Swaminathan, 2013; Mazumdar and Neetha, 2011). As stated in the latest PLFS report, the trend has in fact worsened for rural women since 2011-12, with the FLFPR coming down to 25 percent in 2017-18[3], whereas for urban women, the rate has remained the same at about 20 percent (though most of the decline occurred between 2004-05 to 2009-10). But unemployment rate for urban women has substantially increased from 5 percent in 2011-12 to 11 percent in 2017-18 (Figure 1). Also, the labour force participation rate came down significantly for the (15-29) age group, relative to the other age cohorts. As is reported in the PLFS report, the decline was greater for young men compared to young women, which points to the prevailing job crisis in the Indian labour market, more so for educated young people.
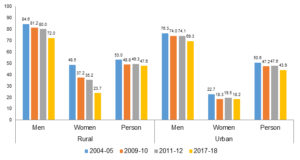
Figure 1: Key labour market indicators for men and women across rural and urban areas, 15+ years, usual status (ps+ss), (2004-05 to 2017-18)
1.Labour force participation rate (%)
2. Workforce participation rate (%)
3. Unemployment rate (%)
Source: PLFS Annual report, MoSPI, GoI, 2019
Note: ps: principal status; ss: subsidiary status
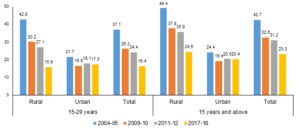
Additionally, rural women’s labour force participation rate declined by as much as 25 percentage points between 2004-05 and 2017-18. As a result, the rural FLFPR – which was double the urban FLFPR in 2004-05 – is now only a little higher than the urban FLFPR. What’s even more striking is that the FLFPR for young rural women aged (15 – 29) years has declined so sharply that it is now lower than the FLFPR for urban women in the same age group (Figure 2). The decline in FLFPR is mostly driven by rural areas, and therefore calls for a deeper analysis of the situation behind this trend.
Figure 2: Women’s labour force participation rate (%) by age cohorts
Source: PLFS Annual report, MoSPI, GoI, 2019
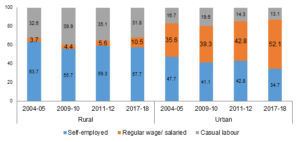
Apart from the disturbing trends outlined above, a positive development in women’s employment is seen in the case of regular salaried employment since 2011-12, as their proportion has increased significantly across both rural and urban areas, albeit more so in case of urban women (and very few women work as regular salaried workers in rural areas) (Figure 3).
Figure 3: Composition of the women workforce in rural and urban areas (%), all ages
Source: PLFS Annual report, MoSPI, GoI, 2019
However as can be seen from Table 1, self-employment is massive for rural women (58 percent), followed by casual labour (32 percent) and regular salaried (10.5 percent). It is important to analyse the characteristics of rural self-employed women workers, as a majority of them work as contributing family workers/unpaid helpers in family enterprises (39 percent), compared to only 10 percent of the men (there are significantly higher proportions of own-account workers and employers among men, across both rural and urban areas). These unpaid family workers contribute to the production economy without receiving any income/wages in return, and are more likely to lack decent working conditions, adequate social protection, and formal work arrangements. Therefore, this puts women in vulnerable situations, and has larger implications for reducing gender inequality.
Table 1: Percentage distribution of workers by status in employment, usual status, all ages, 2017-18
| Category | Rural | Urban | ||
| Men | Women | Men | Women | |
| Own-account worker and employer | 48.0 | 19.0 | 34.9 | 23.7 |
| Helper in household enterprise | 9.8 | 38.7 | 4.3 | 11.0 |
| All self-employed | 57.8 | 57.7 | 39.2 | 34.7 |
| Regular wage salaried | 14.0 | 10.5 | 45.7 | 52.1 |
| Casual labour | 28.2 | 31.8 | 15.1 | 13.2 |
| Total | 100.0 | 100.0 | 100.0 | 100.0 |
| Category | EUS 68th (2011-12) | PLFS (2017-18) | ||
| Rural | Urban | Rural | Urban | |
| Agriculture | 74.9 | 10.9 | 73.2 | 9.1 |
| Mining & quarrying | 0.3 | 0.3 | 0.2 | 0.2 |
| Manufacturing | 9.8 | 28.7 | 8.1 | 25.2 |
| Electricity, water, etc. | 0.1 | 1.0 | 0.0 | 0.6 |
| Construction | 6.6 | 4.0 | 5.3 | 4.1 |
| Trade, hotel & restaurant | 3.0 | 12.8 | 4.0 | 13.0 |
| Transport, storage & communications | 0.2 | 2.7 | 0.3 | 3.3 |
| Other services | 5.2 | 39.6 | 8.9 | 44.4 |
| Total | 100.0 | 100.0 | 100.0 | 100.0 |
The PLFS clearly shows that fewer women are participating in paid market activities, and even when they do join the labour market, they end up in informal jobs, working mostly as unpaid family workers, or as regular salaried workers without job security or social security. Policies should be framed based on the emerging trends and focusing on the overall employment crisis. They should be able to address the constraints faced by women, and enable women to participate in the labour market in large numbers, and particularly in formal productive employment which gets them decent livelihood opportunities.
[1] https://www.business-standard.com/article/economy-policy/unemployment-rate-at-five-decade-high-of-6-1-in-2017-18-nsso-survey-119013100053_1.html